There're 3 types of reports in our app. Let's understand the difference and benefits of each of them:
Blank report page where you can set up any kind of structure you need in a manual way or use our options to automatically move your measures to the spreadsheet in the view you need.
Here you can find all the functions & options possible with the spreadsheet page.
Report page, which automatically collects & groups all the measurements created on a specific drawing.
📘 How to create it?
Simply press the + button on the Sheets bar at the top of the Spreadsheet area and select this type of report to add it to your view. Once this is done, you'll see a report of a specific structure automatically generated by our system.

📘 How to work with it?
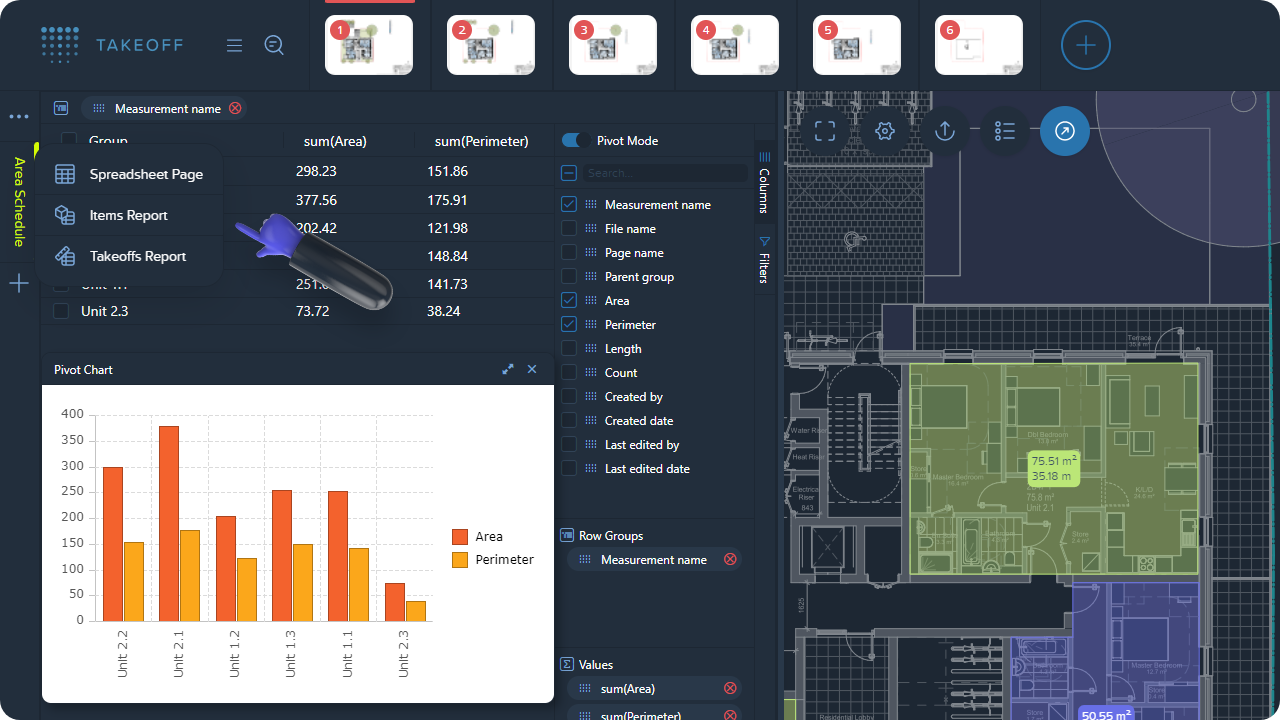
Here below is the list of options available for this type of report:
1) Set up the view you need by removing unnecessary columns or adding some.
2) Group your elements by a specific value or by several values.
3) Set up a sum of quantities for specific values.
4) Filter values in the way you need.
5) Create charts based on the report's data.
6) Switch to & use the Pivot mode.
📝 Note!
The report is automatically updated once you're changing measurements on the drawing or in the Measurements manager. However, you can't modify the values in the report itself.
Report which contains all items, including Assemblies' items, which were applied to measurements.
📘 Its aim
This type of report is a great fit if you need to get a report based on your items & assemblies.
📘 How to create it?
Simply press the + button on the Sheets bar at the top of the Spreadsheet area and select this type of report to add it to your view. Once this is done, you'll see a report of a specific structure automatically generated by our system.
📘 How to work with it?
Here below is the list of options available for this type of report:
1) Set up the view you need by removing unnecessary columns or adding some.
2) Group your elements by specific measurements or properties.
3) Set up a sum of quantities for specific measures.
4) Filter values in the way you need.
5) Create charts based on the report's data.
6) Switch to & use the Pivot mode.
📝 Note!
The report is automatically updated once you're changing measurements on the drawing or in the Measurements manager. However, you can't modify the values in the report itself.