Pivot mode in grid tables allows users to streamline and simplify their data presentation by consolidating multiple measurements of the same type.
To enable pivot mode drag the slider to the "On" position in the table on the right side of the screen.
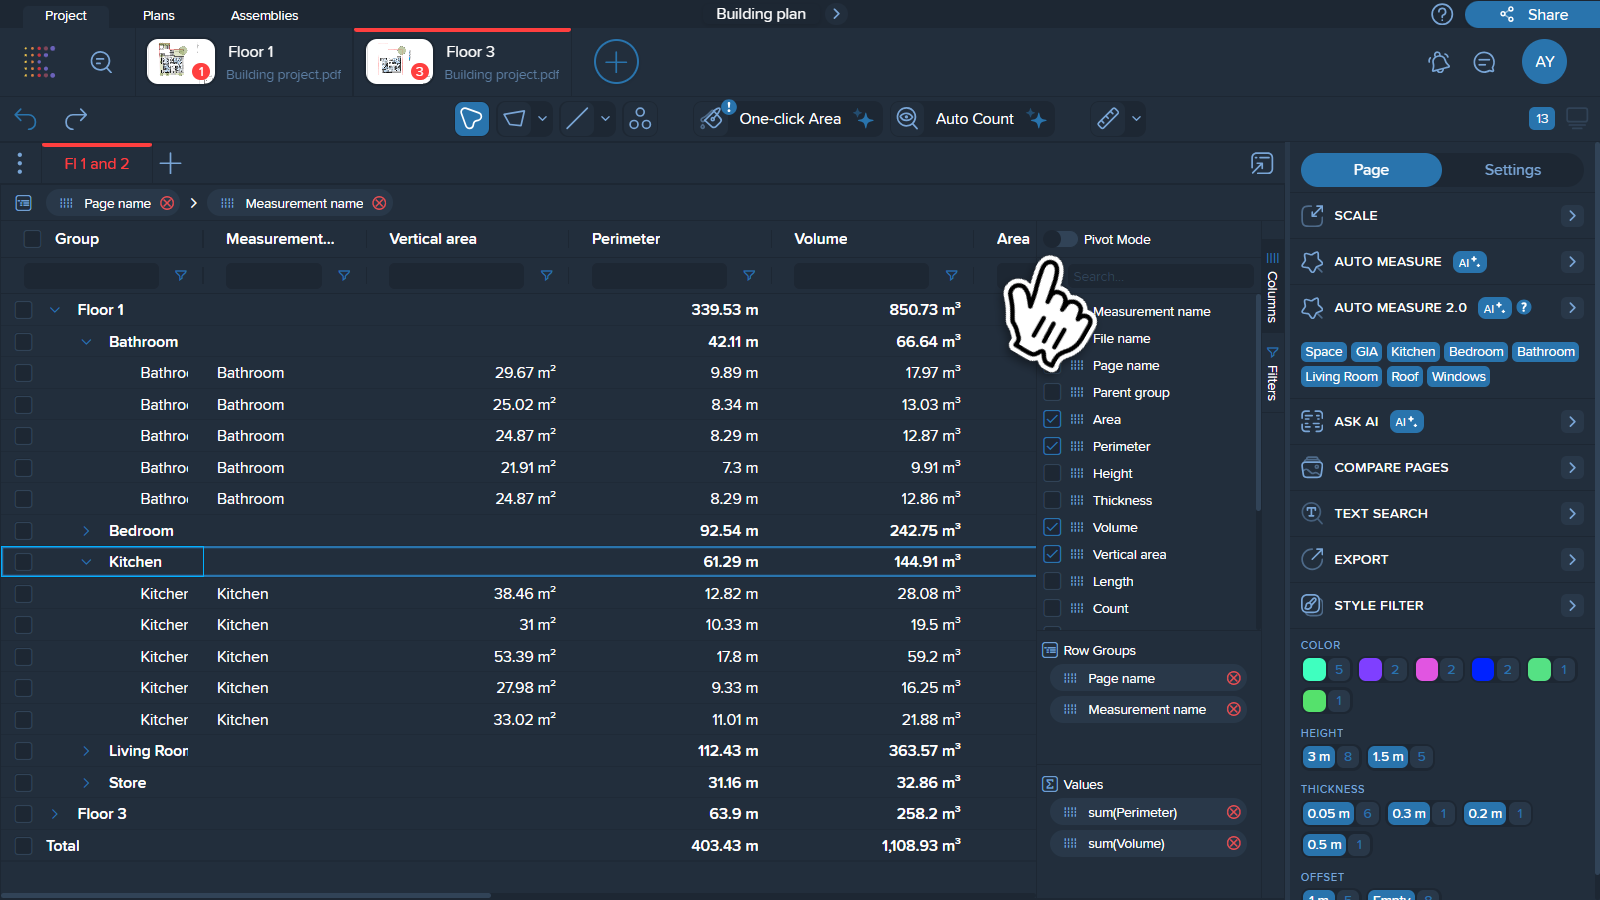
In this mode, instead of displaying each individual measurement separately, the grid table will:
Hide all individual measurements/items: All the individual measurements of a specific type are hidden from the main view.
Display only the measurement type: Only the name of the consolidated measurement type is shown here, rather than the individual measurement names; this represents the overall group into which the measurements have been collapsed in pivot mode.
Show total values: A total value representing the sum or aggregate of all hidden measurements is displayed alongside the measurement name.
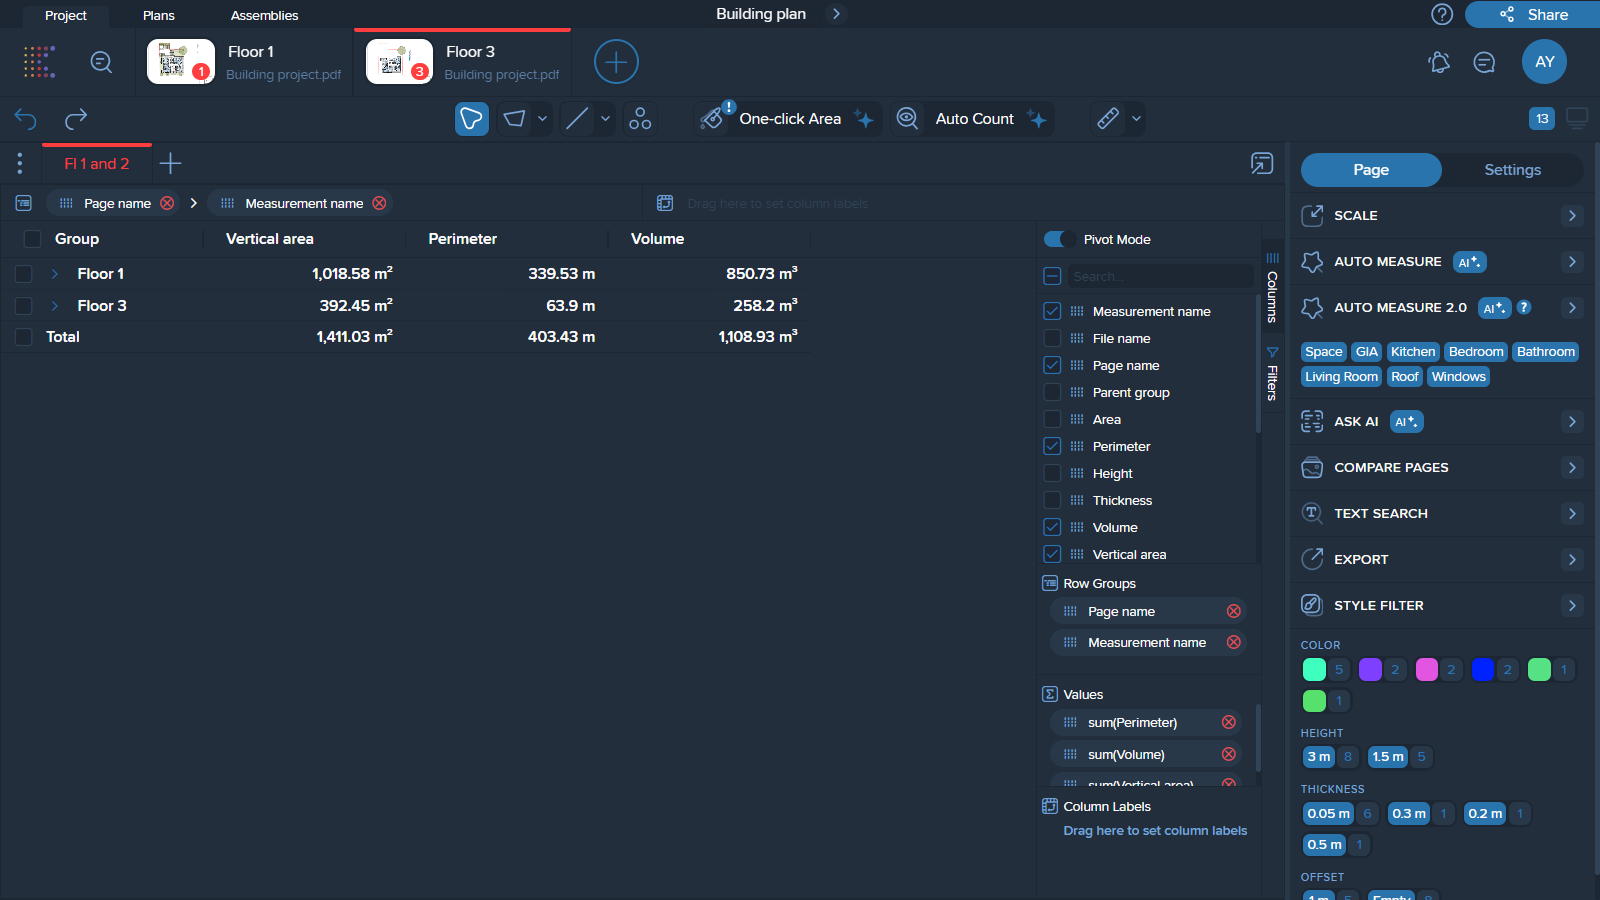
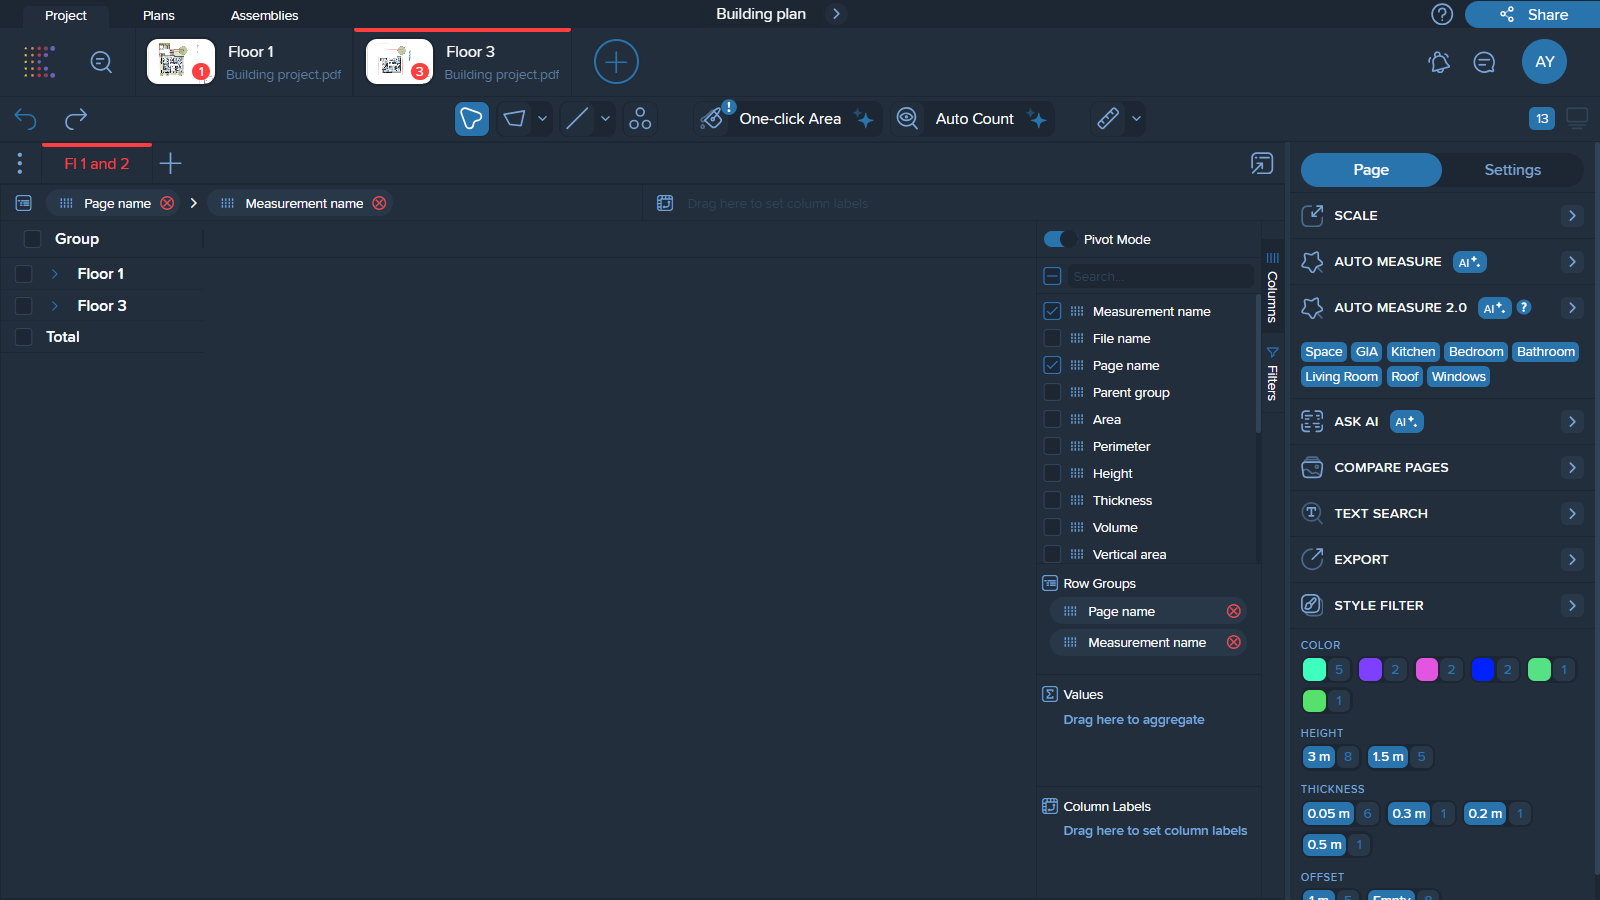
Note ❗ Pivot mode only makes sense when there is an aggregation present. Without value aggregation turned on, pivot mode will display empty columns with no values.
1. With value aggregation
2. Without value aggregation
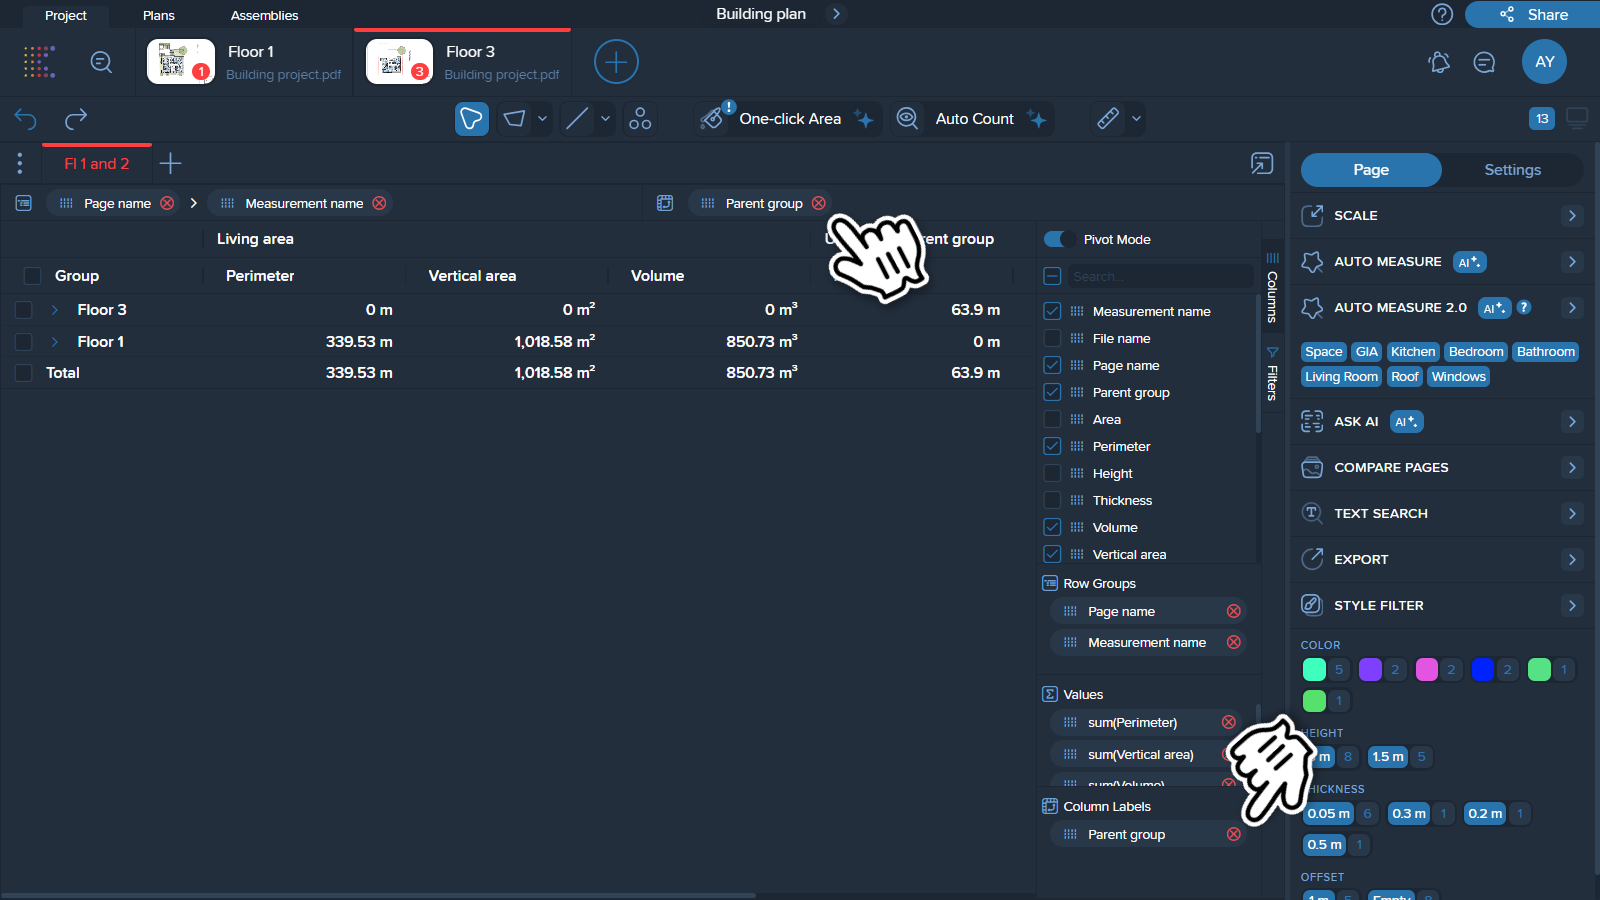
You can pivot desired values by a chosen parameter. For example, area values can be pivoted by page name, so the area for each page is shown in separate columns accordingly.
How to do that
To add a column:
Drag the chosen parameter to the column drop zone at the top of the table.
Or drag to the ‘Column Labels’ section in the bottom right corner.
To hide a column сlick on the cross (X) icon next to the column you want to hide in ‘Column Labels’ section or in the column drop zone.